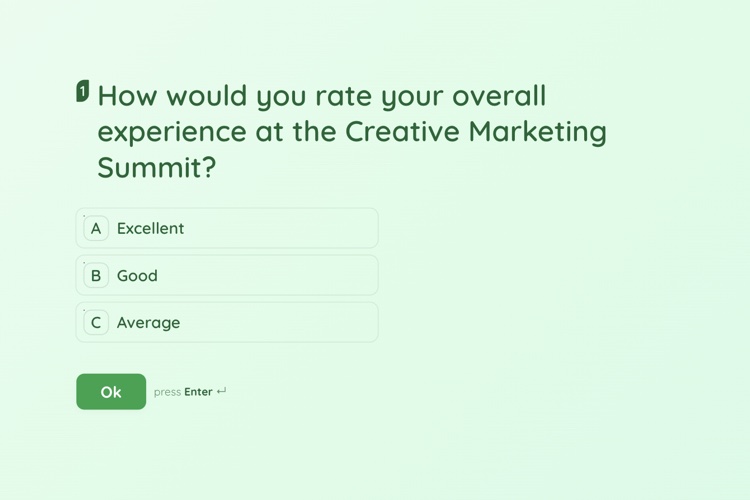
Customer Support Satisfaction Form
Opens with an open text box, then narrows to ratings, so you get the story first and the score second.
View templateTrack how customers feel over time with the standard feedback metrics, and keep every response on your own site, with no per-response fees.
Built for the WordPress ecosystem and the tools you already use
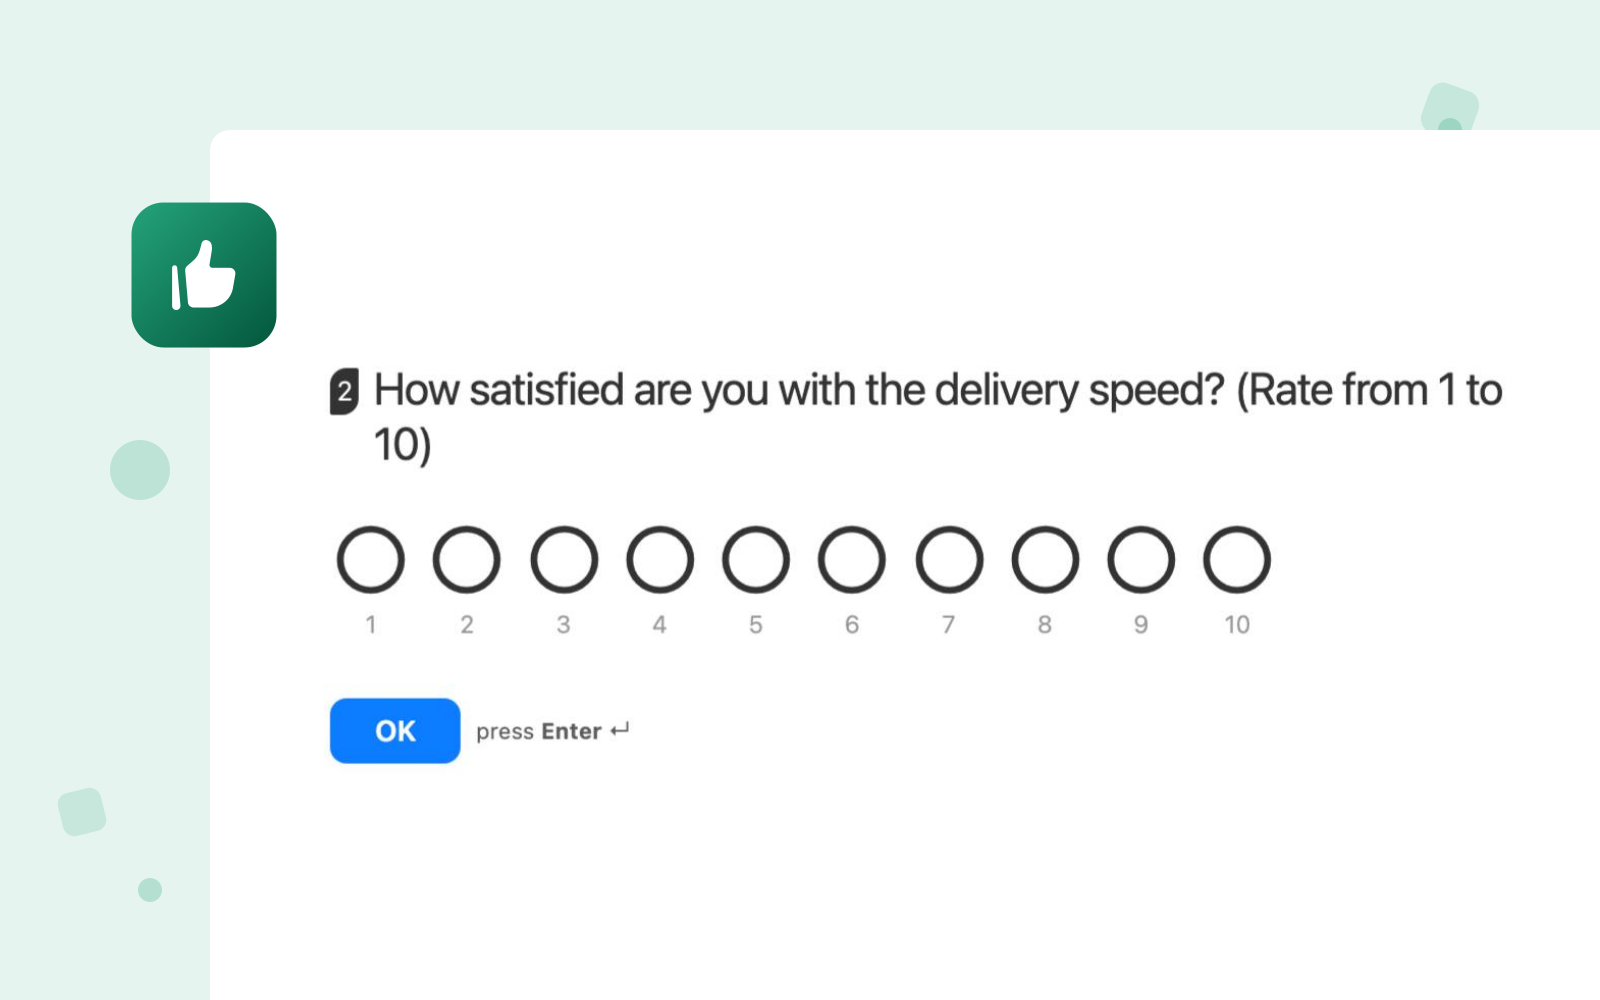
Measure how customers feel with the right question: a 0–10 opinion scale for NPS, and a rating up to ten that runs as stars or as circles. Both are built in.
Pair them with an open text question for the “why” behind the score, and one form gives you a number and a reason at once.
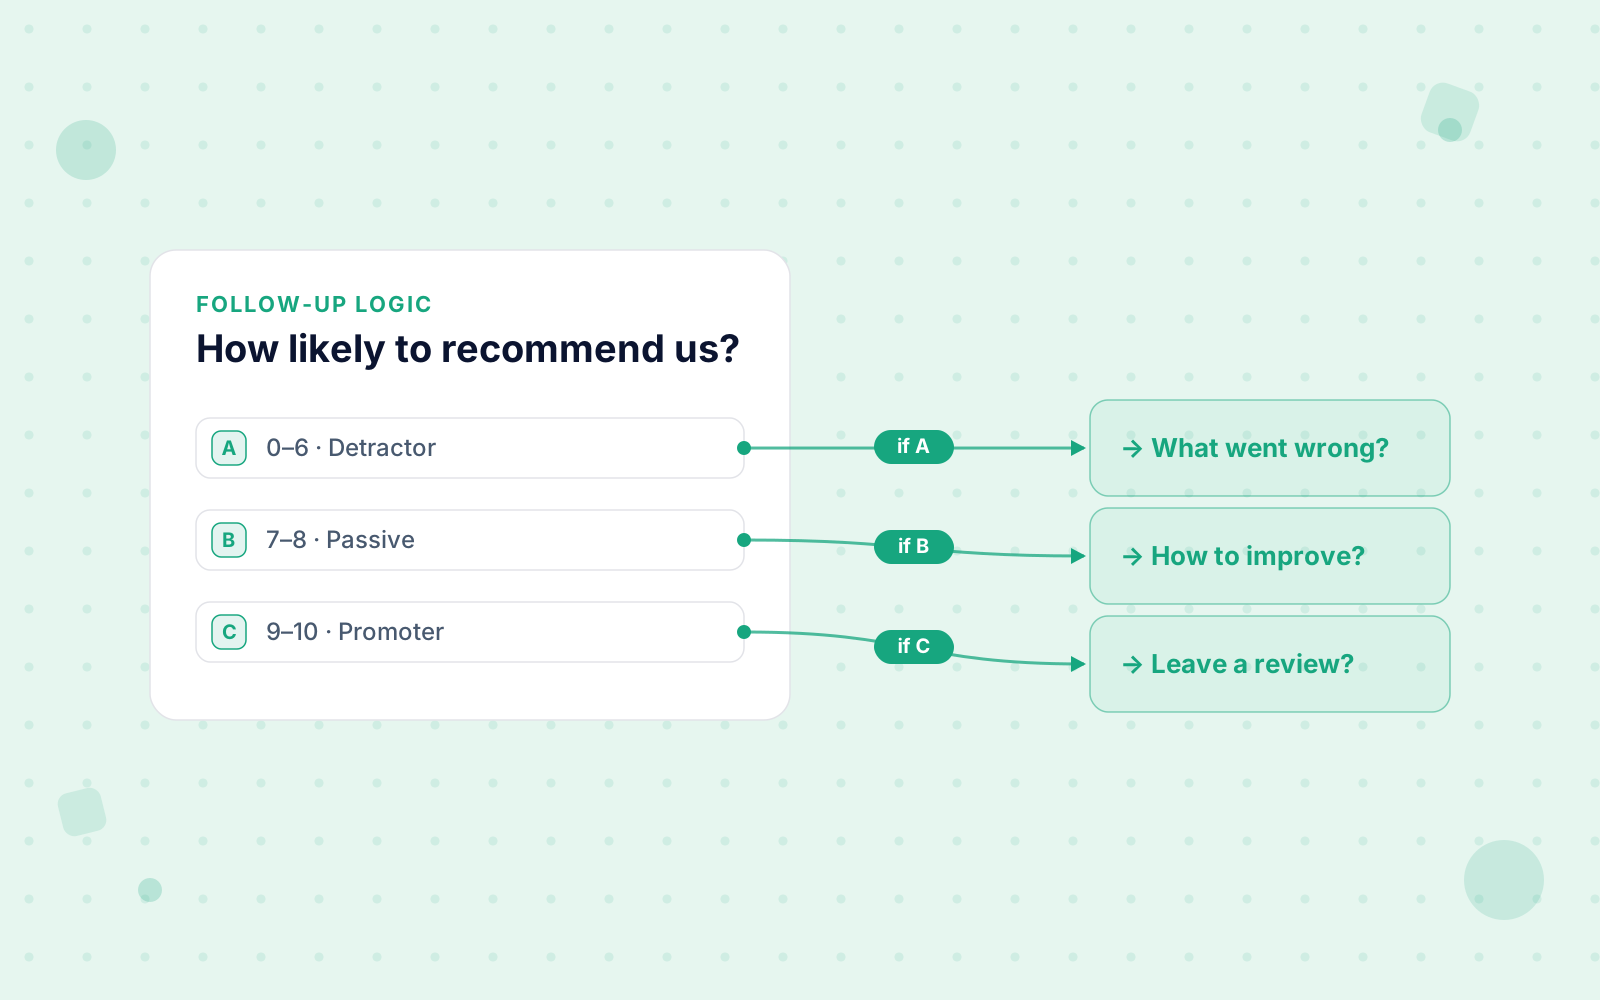
Skip logic turns a flat form smart: a low rating branches to “what went wrong?”, a high one to “mind leaving a review?”
Everyone answers the follow-up that fits their experience, so the answers come back richer.
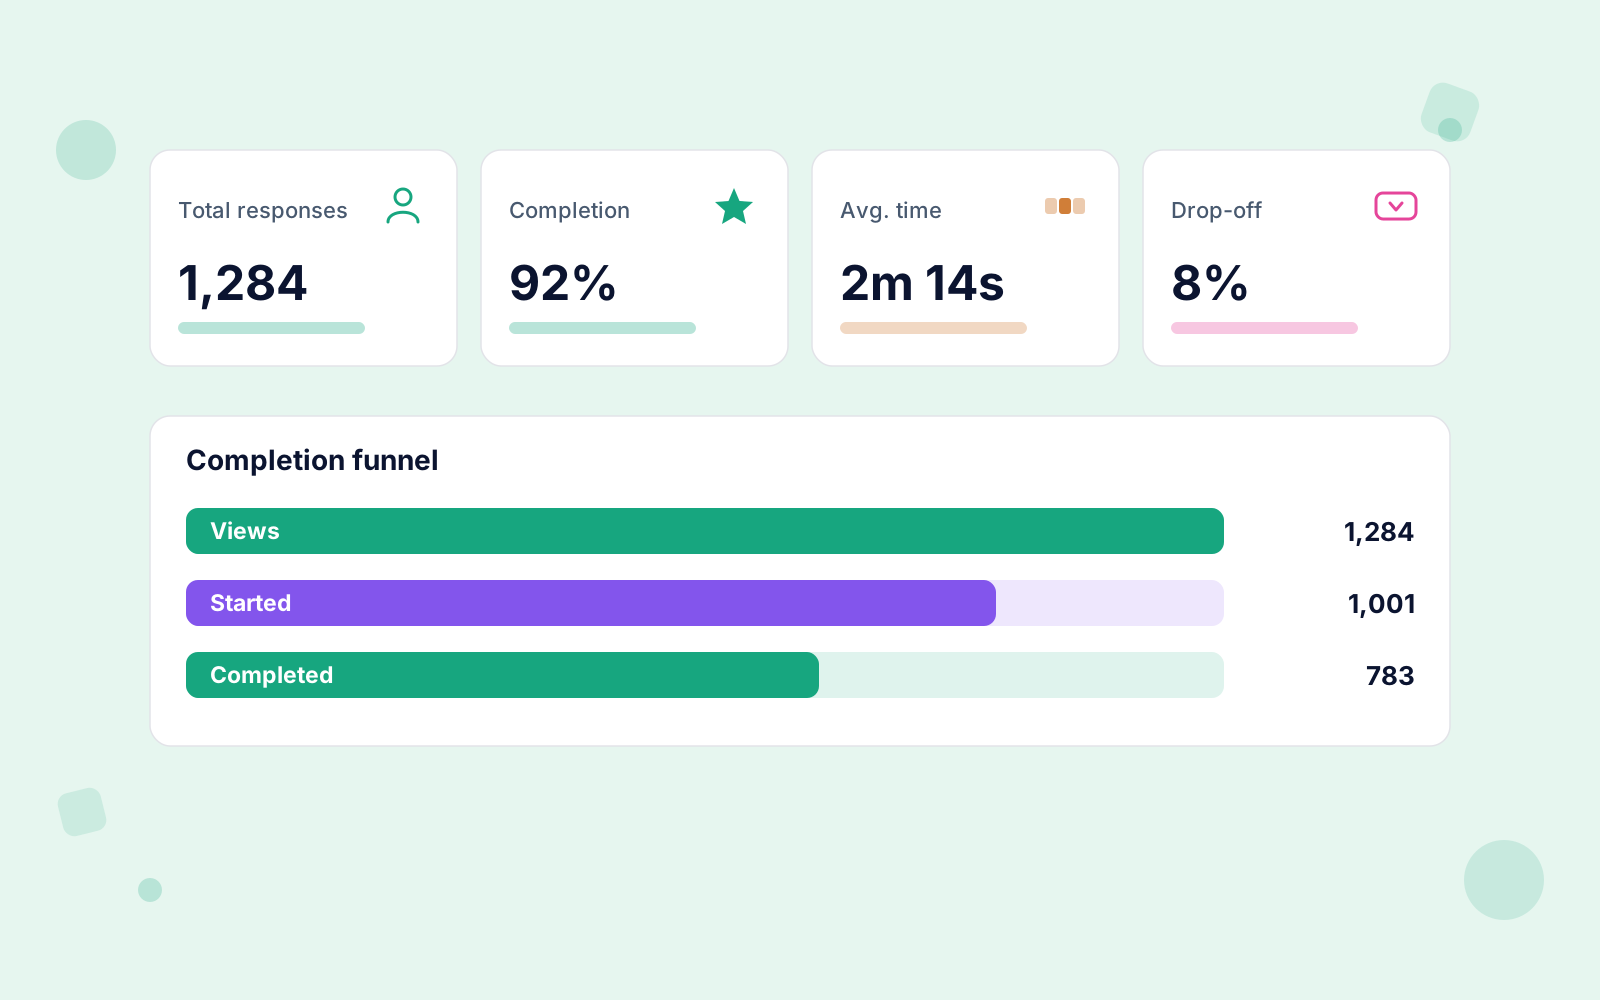
A single score is a snapshot; the trend is the story. Advanced analytics chart responses over time, with a completion funnel, per-question drop-off and average completion time, rolled up across surveys to compare this month to last.
Every response flows into your own WordPress dashboard, with no external service and no per-response fees. Feedback stays between you and the customer: there is no public result screen.
Opens with an open text box, then narrows to ratings, so you get the story first and the score second.
View templateA poor rating branches to a follow-up asking what went wrong, so the people worth hearing from get asked more.
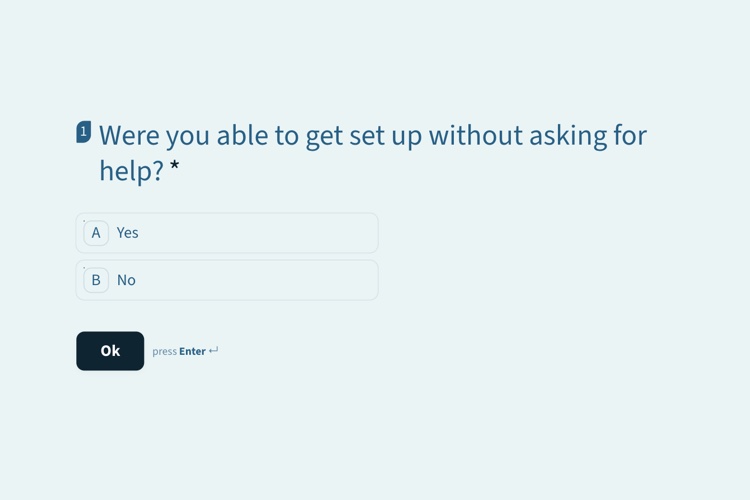
View templateCatches onboarding friction while a new customer still remembers it, in six questions that take under a minute.
View templateFeedback is stored in your own WordPress database: unlimited responses, no per-submission charge, nothing routed through a third party. When you want the raw data in a spreadsheet, CSV export hands you the full set.
How CSAT, NPS and product feedback are collected, scored and exported. Pricing & licensing FAQs
Yes. NPS uses the opinion scale question type, a 0–10 scale, alongside star ratings, and the analytics add charts, trends, a completion funnel and per-question drop-off, plus CSV export.
You do. The dashboard summarizes every response alongside charts, trends, a completion funnel, drop-off and average completion time. Respondents do not: a result screen exists only on a Quick Vote, so feedback stays between you and the customer.
In your own WordPress database, with unlimited responses and no per-submission charges. CSV export hands you the raw data when you want it elsewhere.
Yes. An email alert goes out as soon as someone completes the survey, personalized with the respondent’s details and the survey name. It goes to one address, set once under Settings → Email.