Turn responses into decisions
Live results the moment someone submits, and a dashboard behind them: response trends, a completion funnel, per-question drop-off and one-click CSV export. All of it on your own site, with no third-party SaaS.
Built for the WordPress ecosystem and the tools you already use
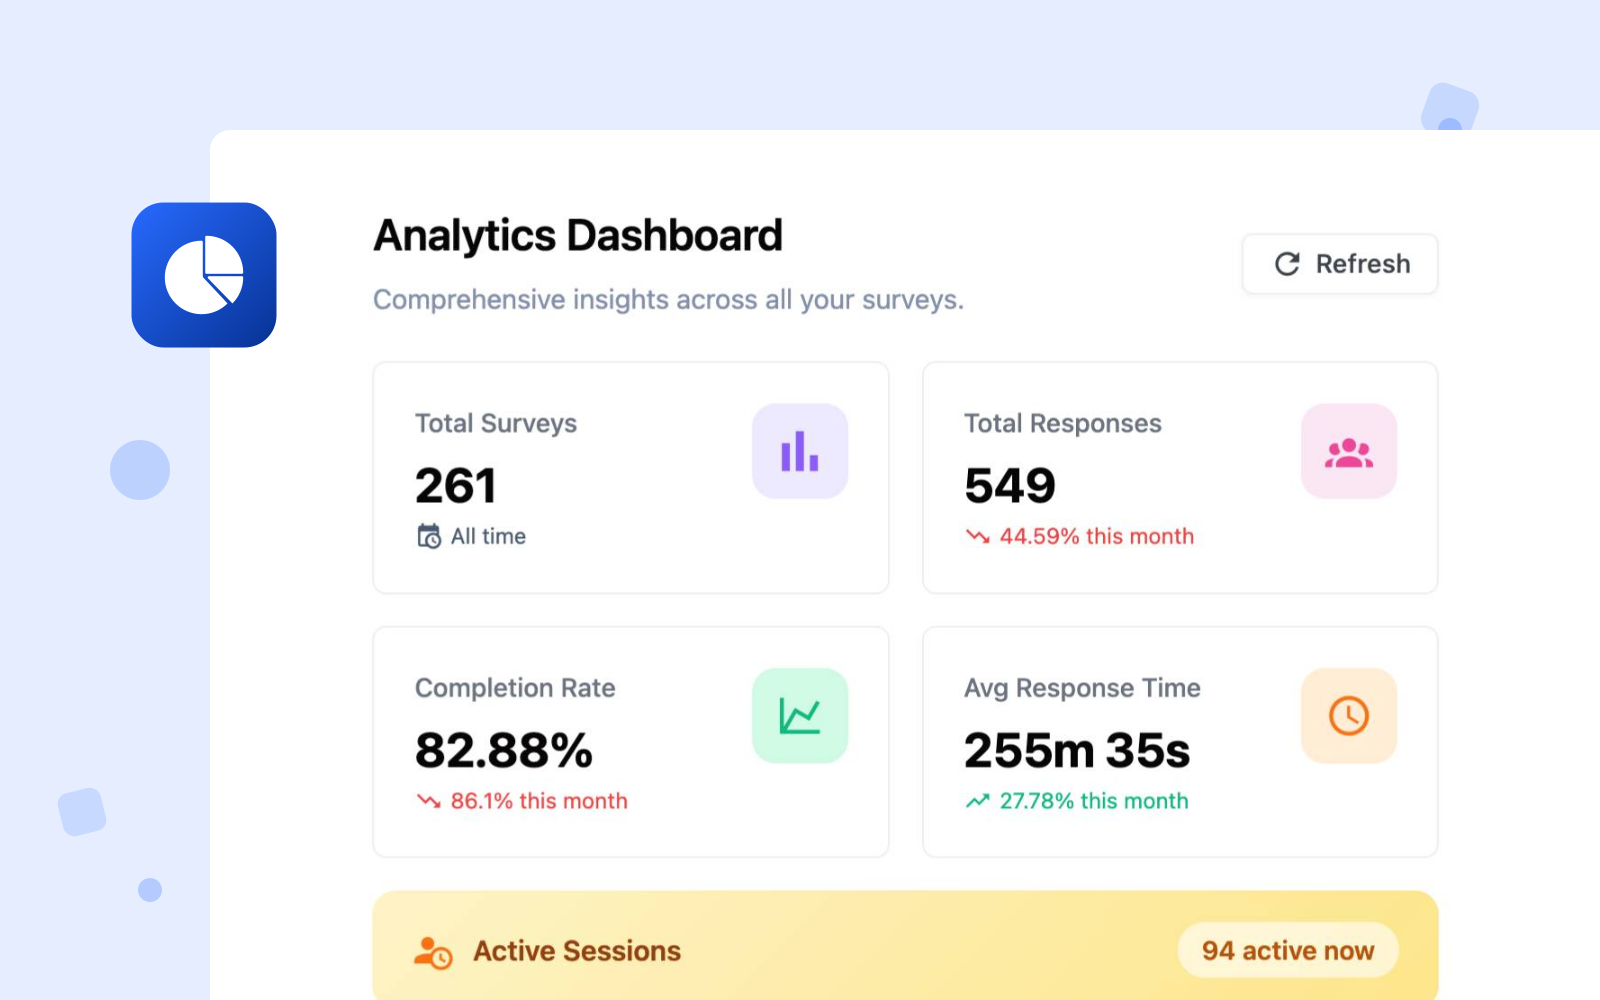
A clear dashboard from day one
Every response lands in wp-admin. Four tiles answer the first questions you will have: how many came in, how many people started, how long the average one took, and what share gave up before the end.
On a Quick Vote you can let voters see the tally too. Switch on view votes in results and the closing screen offers it, their own vote already counted.
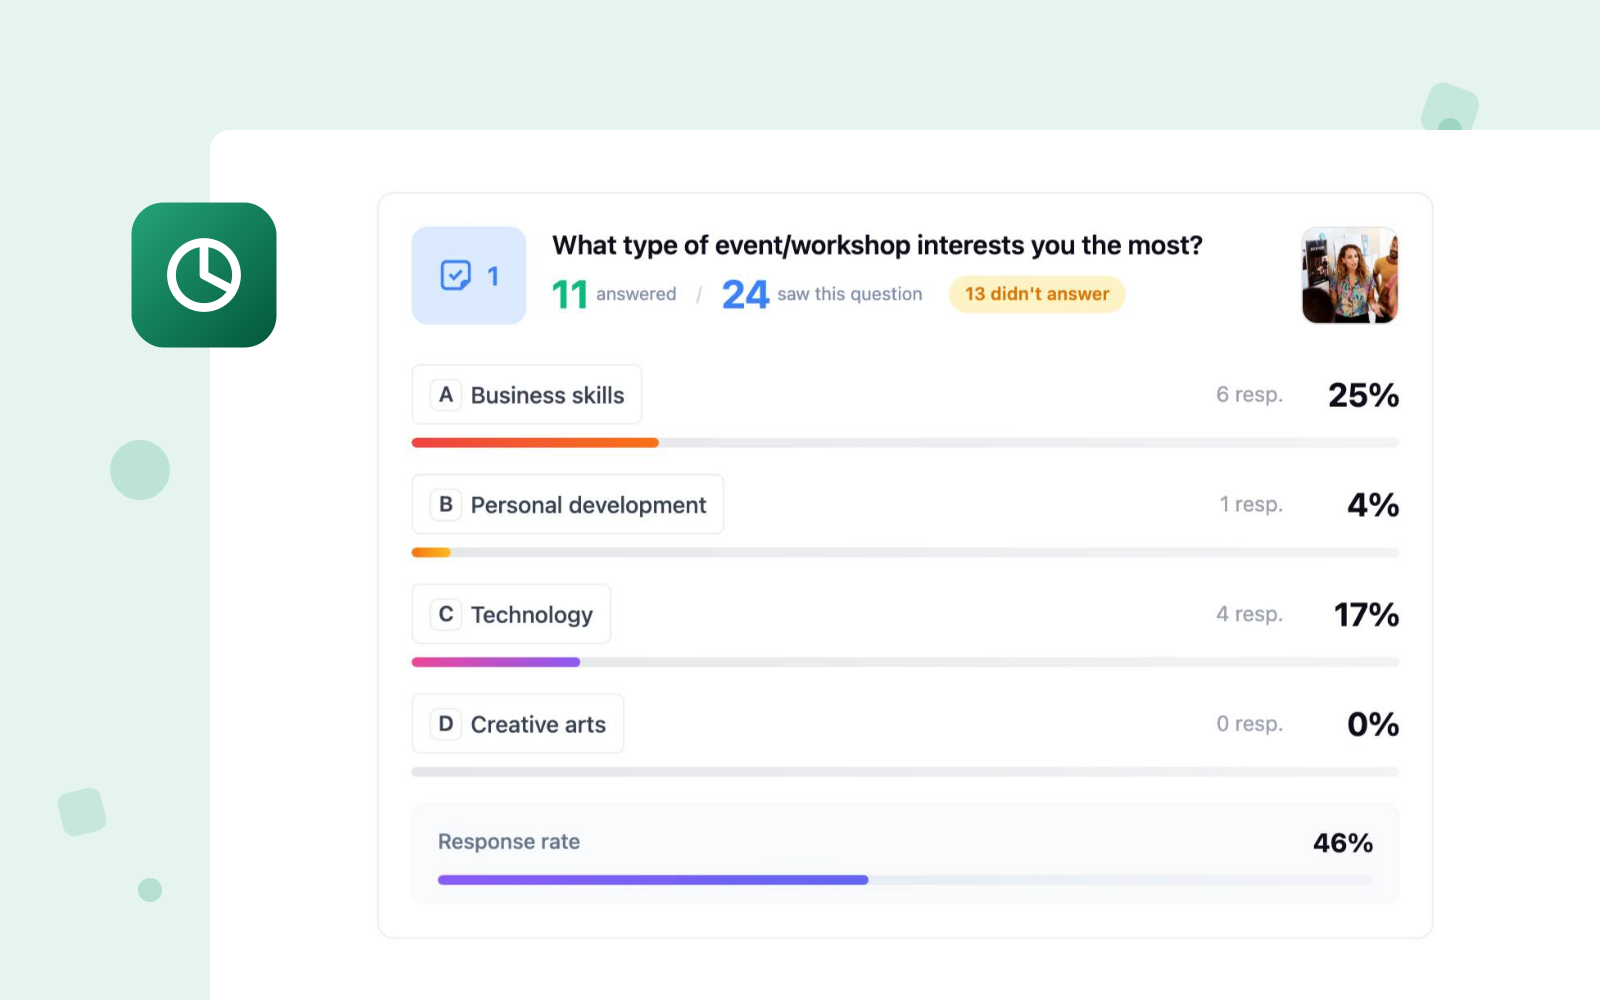
Every answer, broken down
The summary walks the survey one question at a time: how many saw it, how many answered, what each option took. Every option gets a count, a percentage and a bar, down to the ones nobody picked.
Rating and 0–10 questions get their average. Open text collects into a list you can read straight through, instead of a number that tells you nothing.
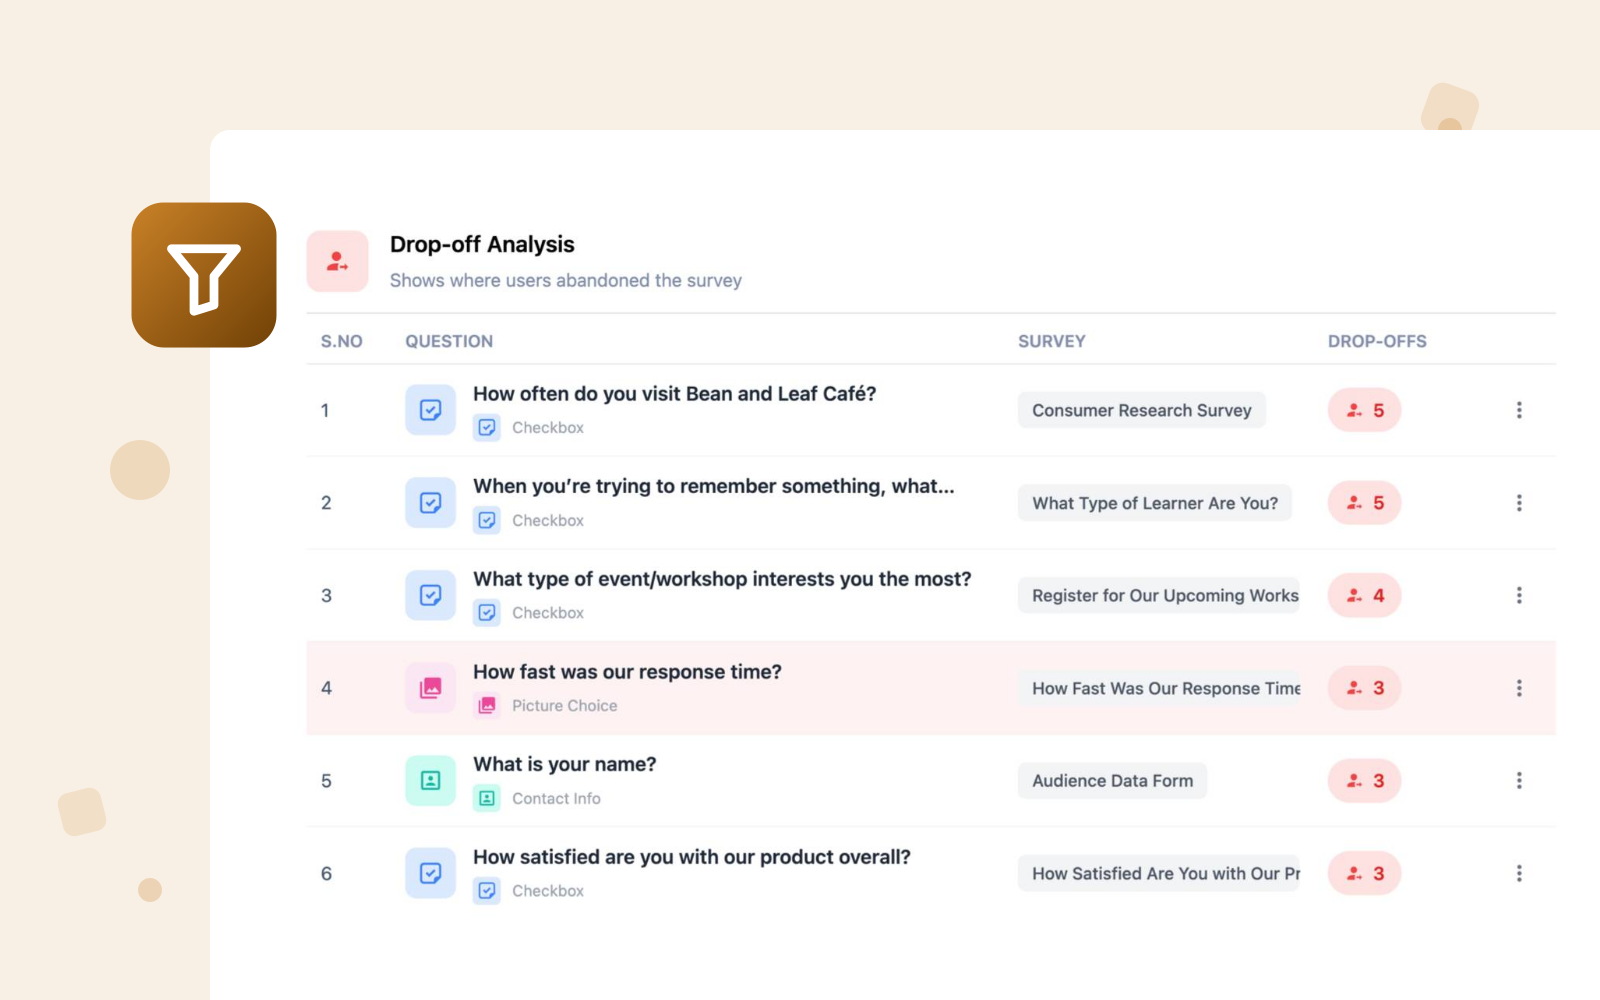
See exactly where people give up
A completion funnel counts views, starts and finishes. That separates a survey nobody opens from one nobody finishes, which are two different problems. All of it is free.
Pro takes it down to the question: how many saw each one against how many answered it. A drop-off table ranks your questions by how many quit there and marks the worst Highest. Rewrite that one question and the funnel moves.
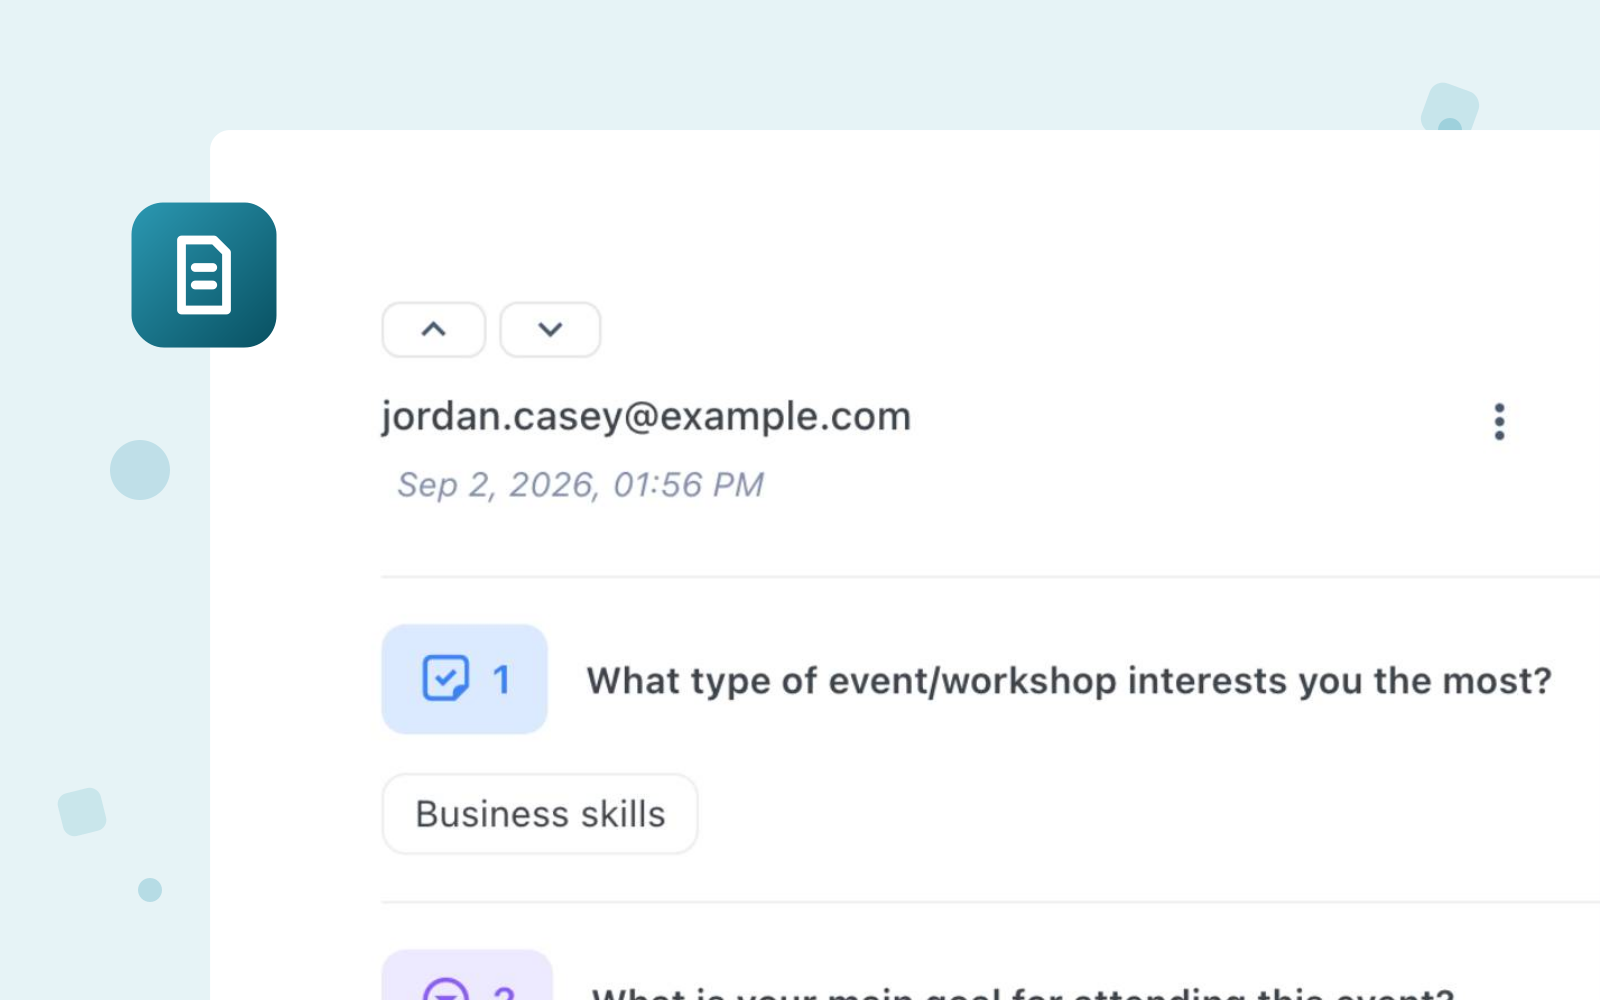
Open a single response and read it end to end
Pro adds the responses table: every submission listed and searchable. Click a row and it unfolds question by question, with the ones they skipped marked as skipped rather than left blank.
Contact-info answers come with it, so the response carries a name, email and phone, plus the timestamp it landed.
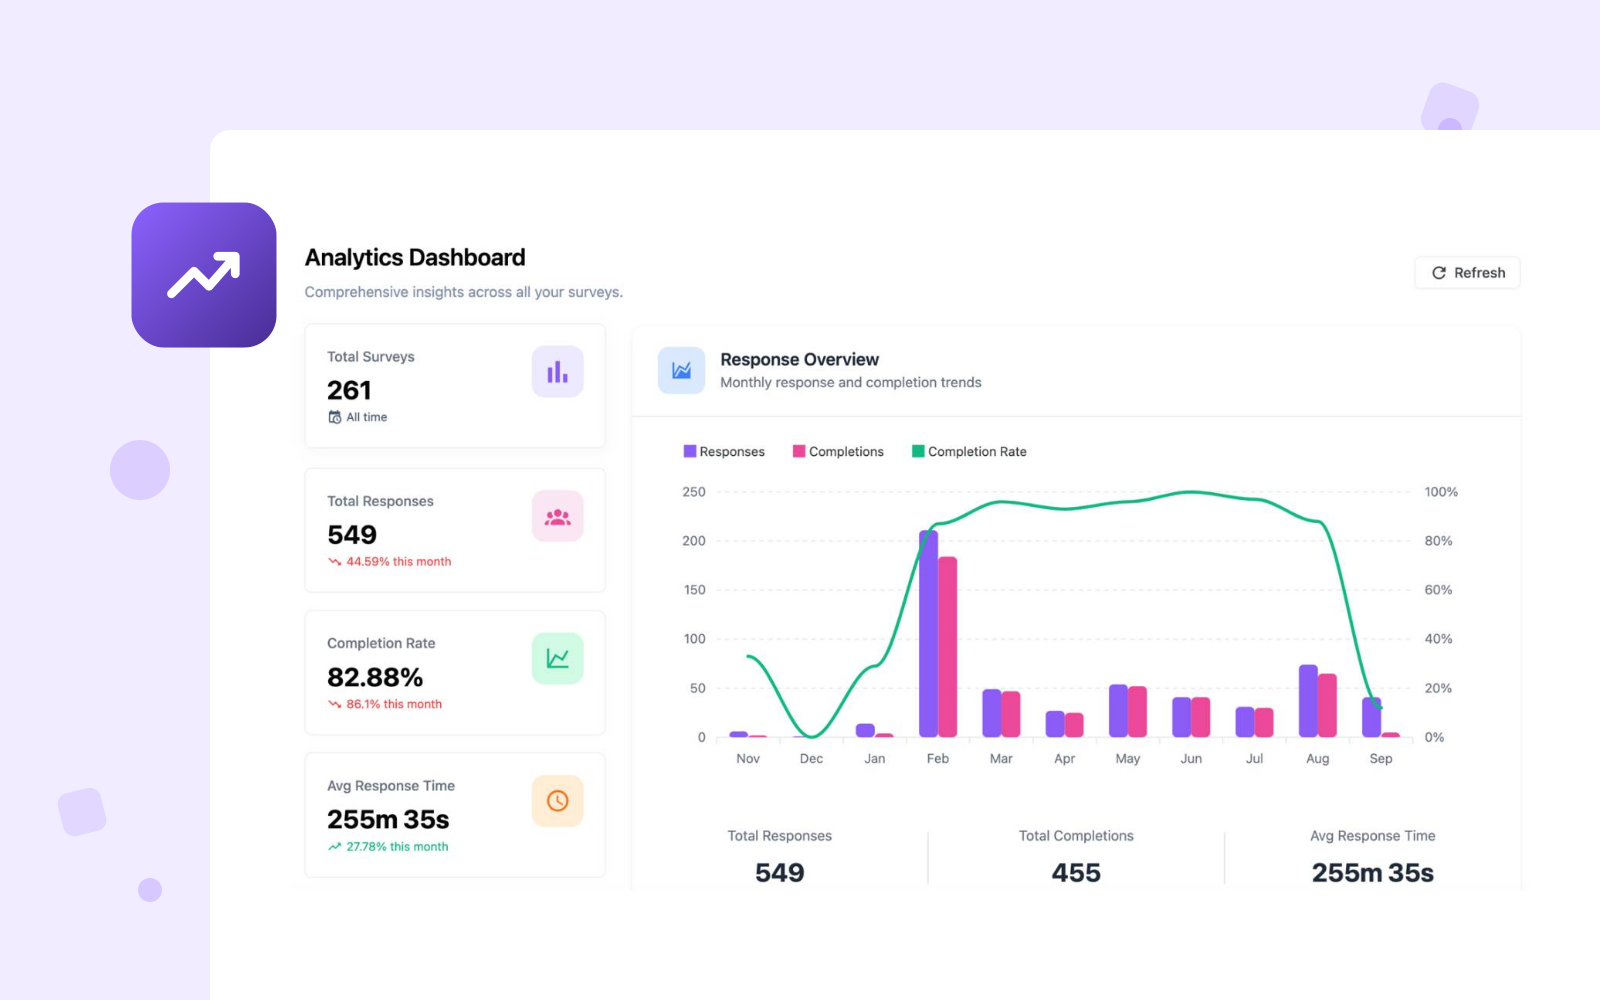
This month against last, across all of them
Pro also adds a dashboard above the individual surveys: monthly response and completion trends on one chart. Total responses, completion rate and average response time sit beside it, each showing the change on last month.
Below that, every survey you run sits in one ranked table. The one quietly outperforming the rest is the first thing you see, not something you go hunting for.
Export it, and keep it forever
Export is Pro, and it hands you two files. The responses: one row per respondent, one column per question. The summary: totals for the survey, plus every question’s answers, counts and percentages. Both are plain CSV, so they open in whatever you already use.
Everything they are built from was already sitting in your own WordPress database, on your own hosting. You own 100% of it: no SaaS, no per-response fees, nothing held hostage.
Analytics questions?
We have the answers
What the dashboard shows, how far the analysis goes, and where your response data lives. Pricing & licensing FAQs
A real-time dashboard inside wp-admin showing every response as it lands, with per-answer totals and percentages. No refresh, no waiting, and no third-party service in the middle.
Free gives you the completion funnel: views, then starts, then finishes. Average completion time and drop-off rate sit beside it, plus a summary breaking every question into each option’s count and share. Pro adds question-level reporting: how many saw each question against how many answered, and a table ranking the question people quit on. It also adds every individual response with a detail view, and a cross-survey dashboard comparing this month with last.
Yes, with Pro, as two CSV files: the responses, one row per respondent and one column per question, and the summary, carrying the survey’s totals and every question’s answers, counts and percentages.
In your own WordPress database, on your own hosting. Nothing is sent to us, so there is no per-response pricing and no monthly data fee no matter how much you collect.