Read your survey's analytics numbers
Every survey has an Analytics tab with an Insights screen and a Summary screen. Insights gives you the survey-wide numbers; Summary breaks results down question by question. This page defines every number on both screens as a formula, so you can reconcile a figure you're looking at rather than guess at what it means.
What counts as a response vs a partial
A session counts as a response — these docs' term for a completed session — only once it
reaches completed status. Every other session is a partial: still in progress, abandoned, or
expired. A partial's answers are kept and are still counted in the per-question numbers below;
the session never counts toward your response total. See Open an individual
response for what a partial looks like once you open it.
Views, starts, and responses
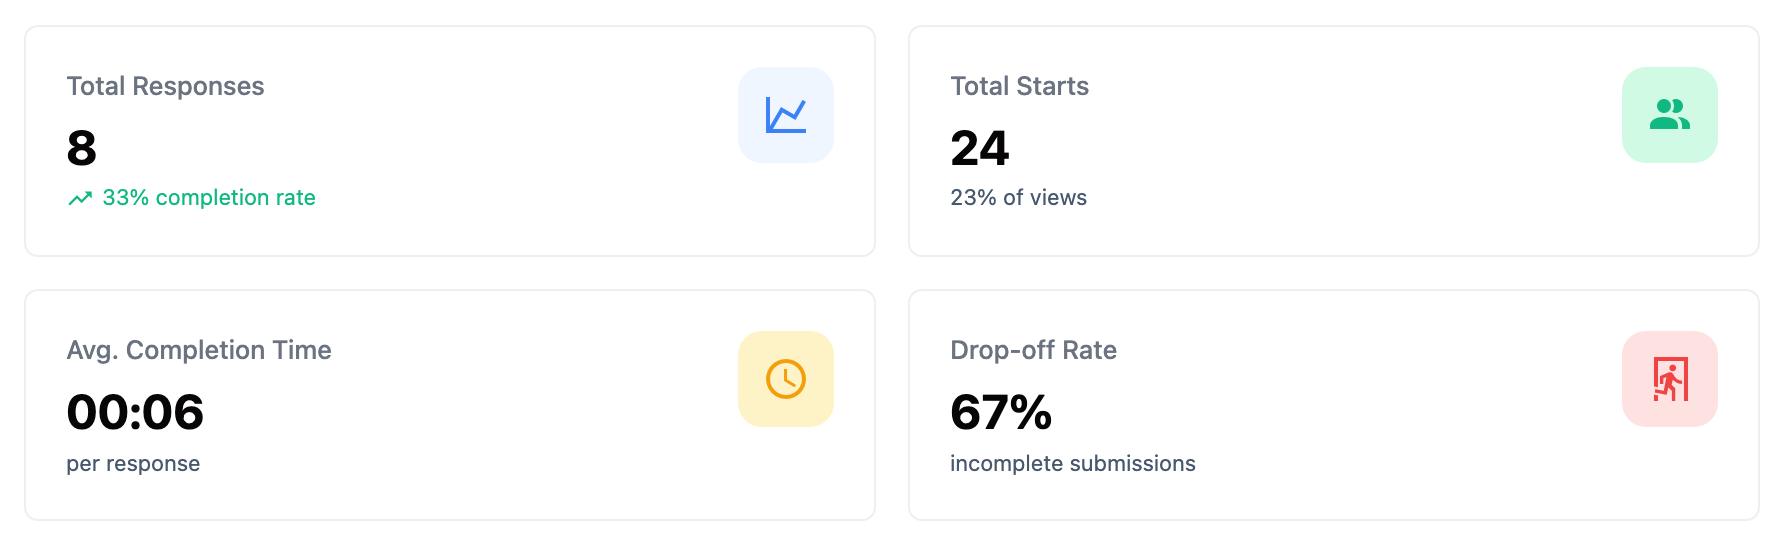
| Number | How it's counted |
|---|---|
| Total views | +1 the first time someone loads the survey and a session is created for them — roughly once per unique visitor, not once per page load. It never decreases, even after you delete responses. |
| Total starts | Sessions that moved past being viewed: active, completed, or dropped off. A session that was only viewed, or has expired, isn't a start. |
| Total responses | Sessions with status completed. |
| Total drop-offs | Sessions marked dropped off, plus any in-progress session that's been idle more than 10 minutes. That second part means a stalled session counts as a drop-off right away — SurveyX doesn't wait for its hourly cleanup to relabel it before counting it. |
Completion rate and drop-off rate
- Completion rate = responses ÷ starts × 100, rounded to 2 decimal places. Shows 0% when there are no starts yet.
- Drop-off rate = drop-offs ÷ starts × 100, rounded to 2 decimal places. Same 0% floor.
Average completion time
The average time spent across completed sessions only, and only sessions between 0 seconds and 4 hours — anything outside that range is excluded, so one tab left open overnight can't skew the average. When no completed session qualifies, SurveyX shows an em dash (—), not 0.
Engagement rate and bounce rate
- Engagement rate = starts ÷ views × 100, rounded down.
- Bounce rate = (views − starts) ÷ views × 100, rounded.
Both show an em dash instead of a percentage when the view count can't support the ratio — views has to be greater than 0 and at least as high as starts. Because total views never decreases, deleting old sessions or responses can push starts above views; when that happens SurveyX shows — rather than a rate that would read as negative or over 100%.
Completion funnel
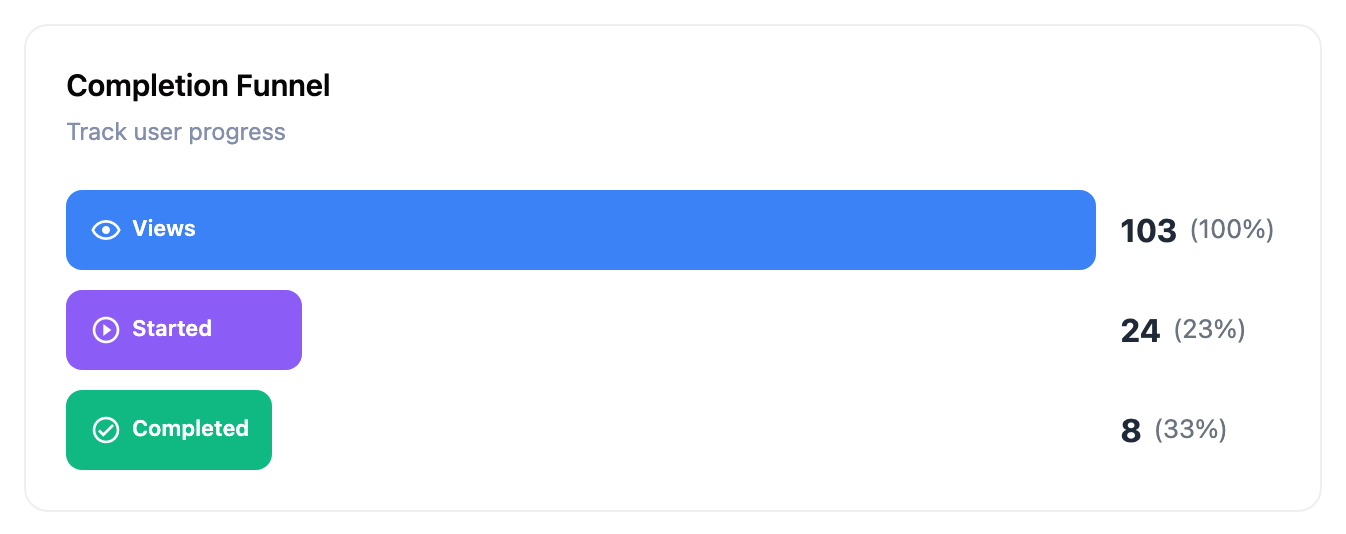
Three stages, each a share of the stage before it:
- Views — 100% of itself, the baseline.
- Started — the engagement rate above.
- Completed — responses ÷ starts × 100, rounded. This is a share of who started, not a share of who viewed.
Per-question numbers (Summary tab)
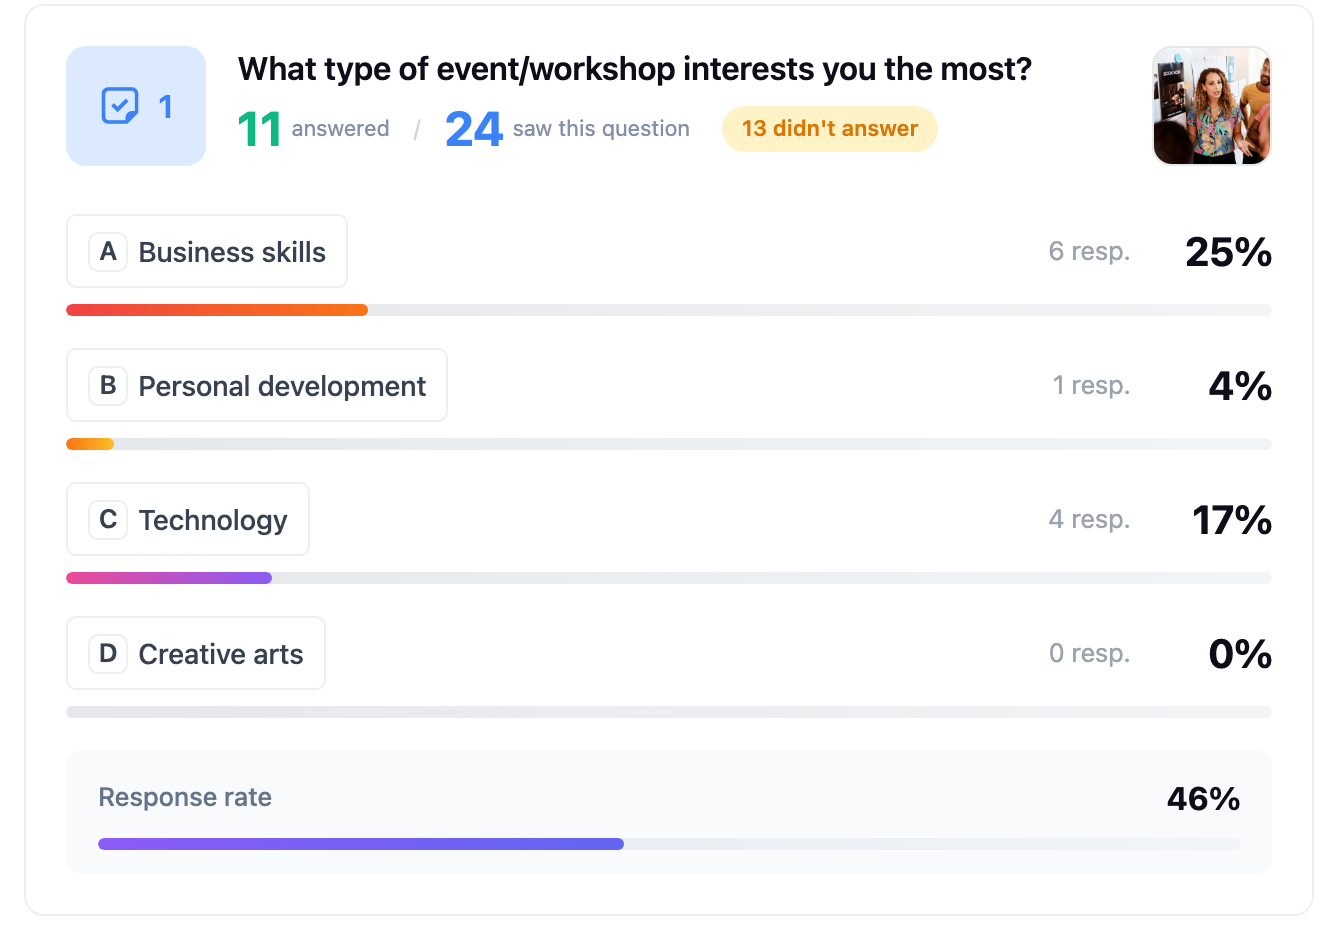
- Choice questions (multiple choice, multi-select, dropdown, yes/no, image choice): each answer option shows votes ÷ respondents who saw the question × 100, rounded. That's votes as a share of who saw the question, not a share of total votes cast — on a multi-select question, where one respondent can pick several options, the bars don't have to add up to 100%.
- Opinion scale and rating (Pro): count, average (sum ÷ count, rounded to 2 decimal places), minimum, maximum, and how many respondents picked each value.
- Matrix / Likert (Pro): a count and percentage for every row-and-column combination, plus a per-row average — weighted by each column's numeric value, rounded to 2 decimal places. The average only needs one column in that matrix to carry a numeric value; columns with no numeric value are simply left out of the weighting, not counted as zero. The average is missing only when a row has no numeric column at all.
- Text input, contact info, date, and file upload: no per-answer breakdown. The Summary tab shows a response count and points you to the response export instead.
Drop-off report (Pro)
Below the funnel on the Insights screen, Pro adds two per-question tables showing exactly where people stall.
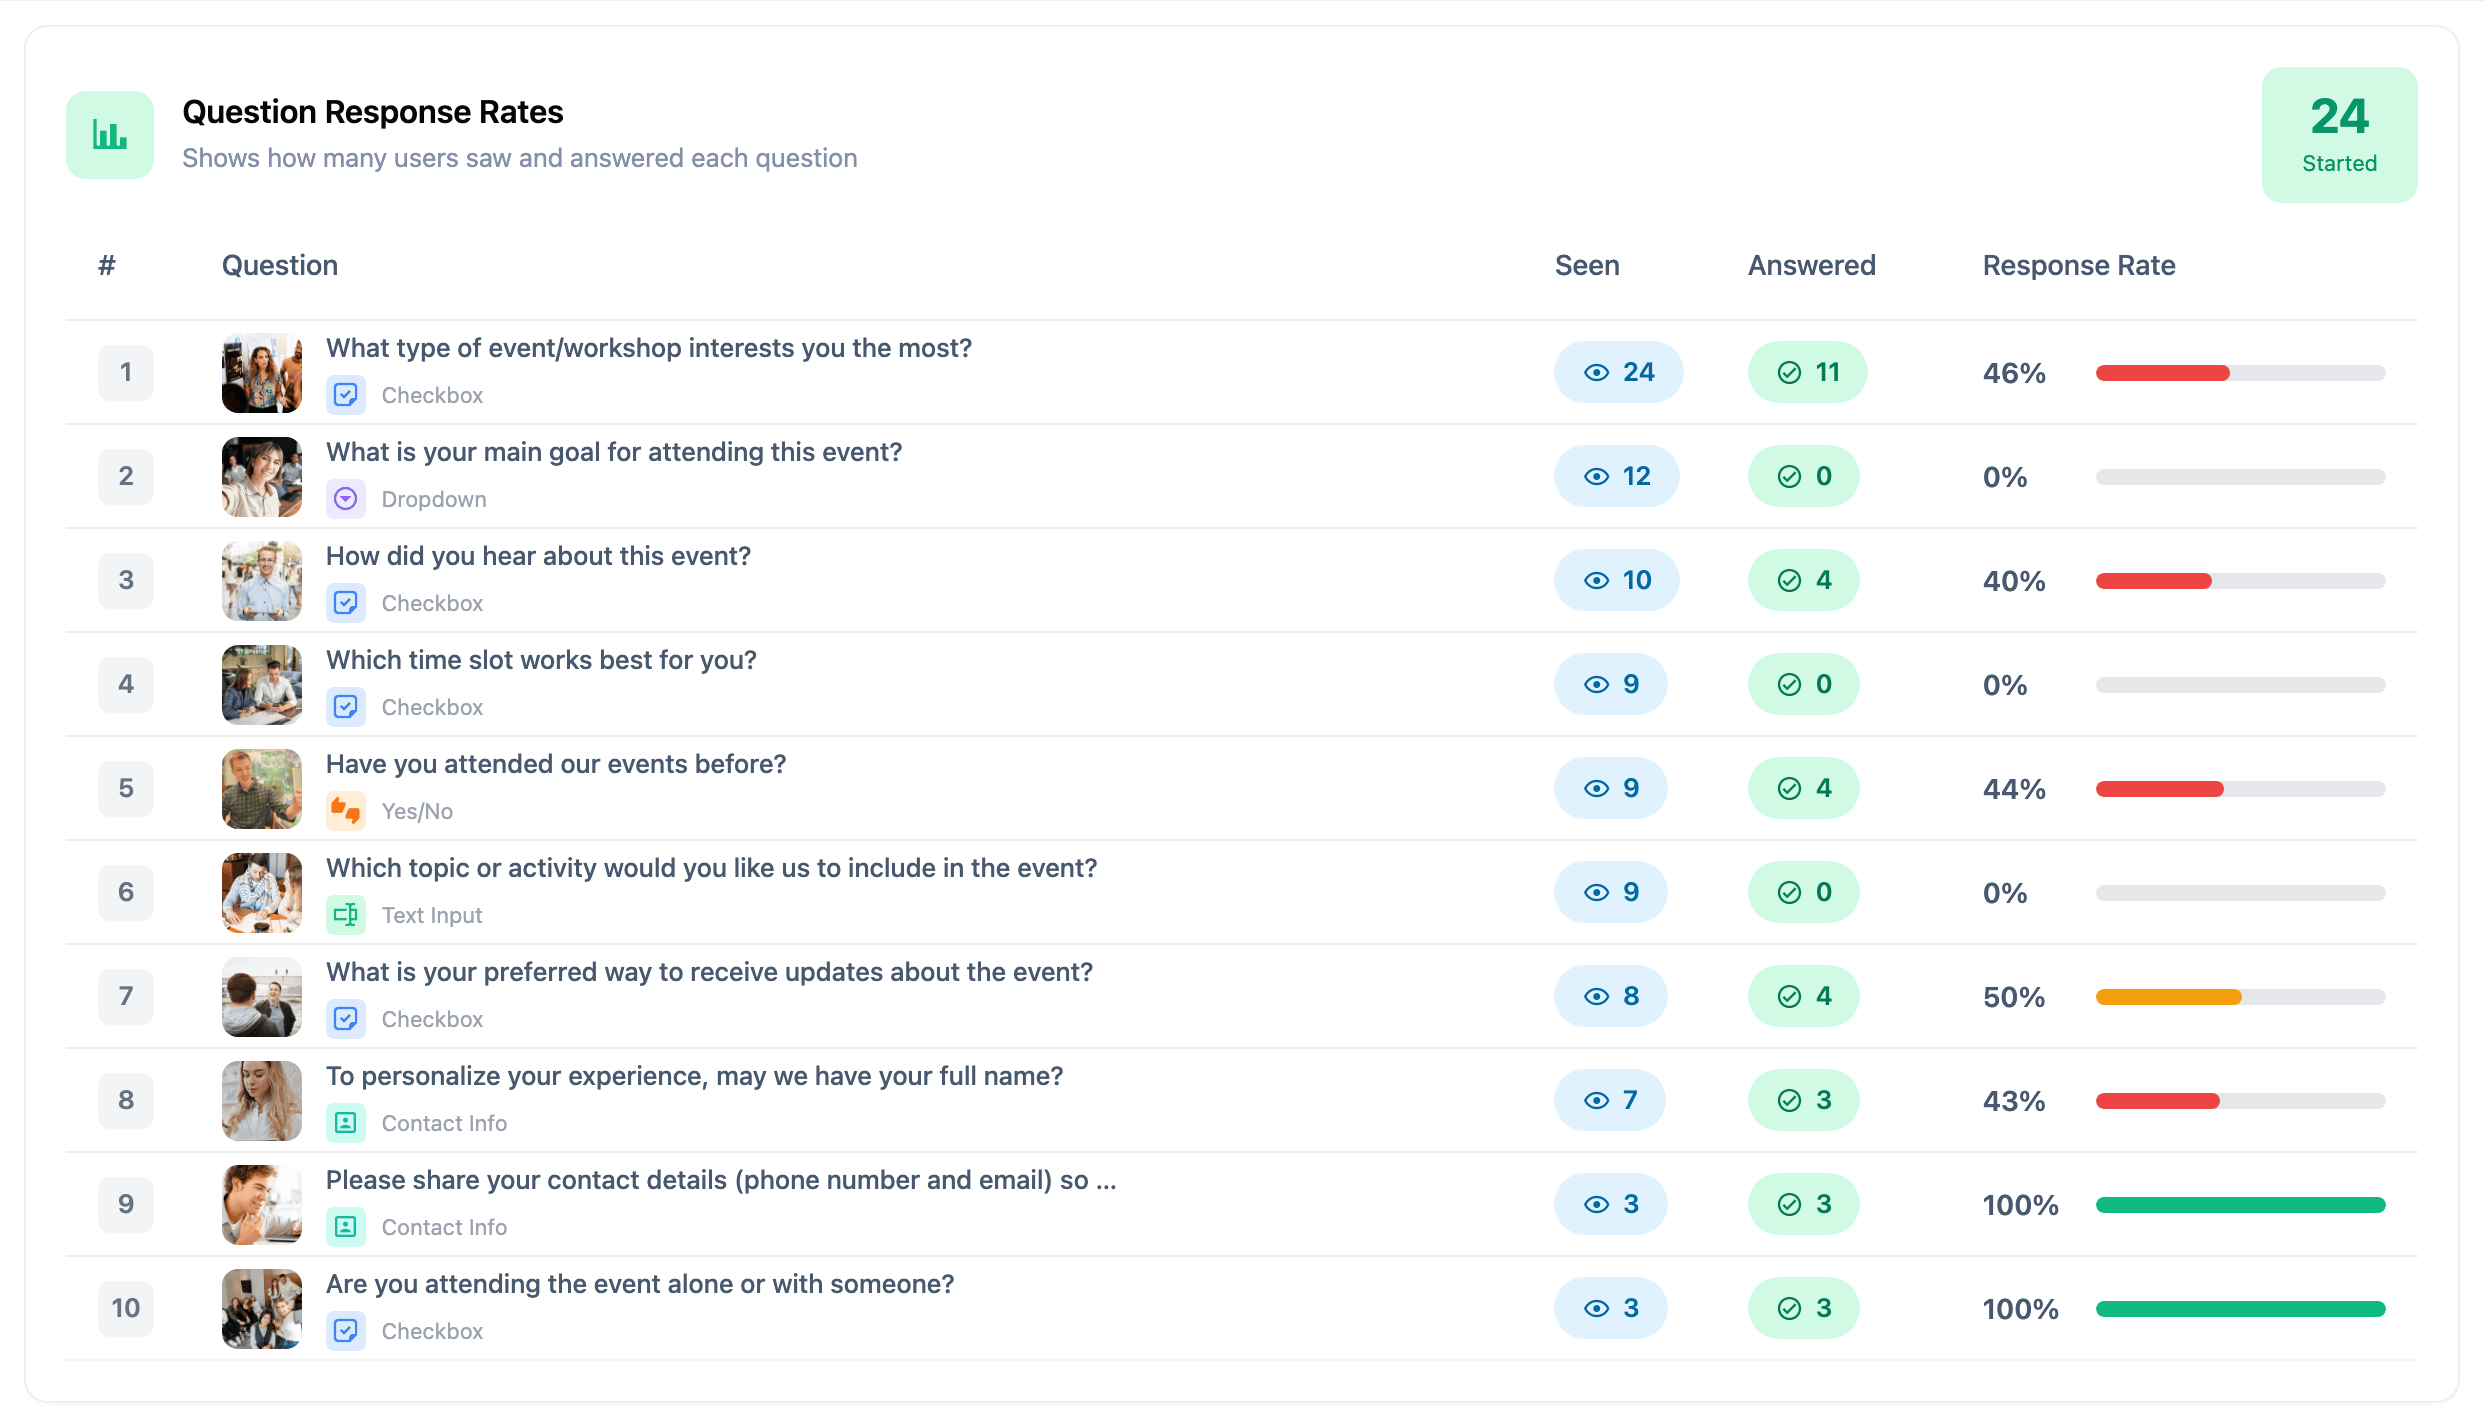
Question Response Rates lists every question with its Seen and Answered counts and a Response Rate bar — answered ÷ seen × 100, rounded and capped at 100%. The bar is colour-coded, so the questions people skip stand out without reading the numbers.
Drop-off Analysis ranks the questions people abandon on. It opens with a Total Drop-offs figure, then lists each question's Drop-offs count and a % of Total column — that question's drop-offs ÷ total drop-offs × 100. The question at the top of this table is where you're losing the most people; if two questions tie, there's no documented tiebreak.
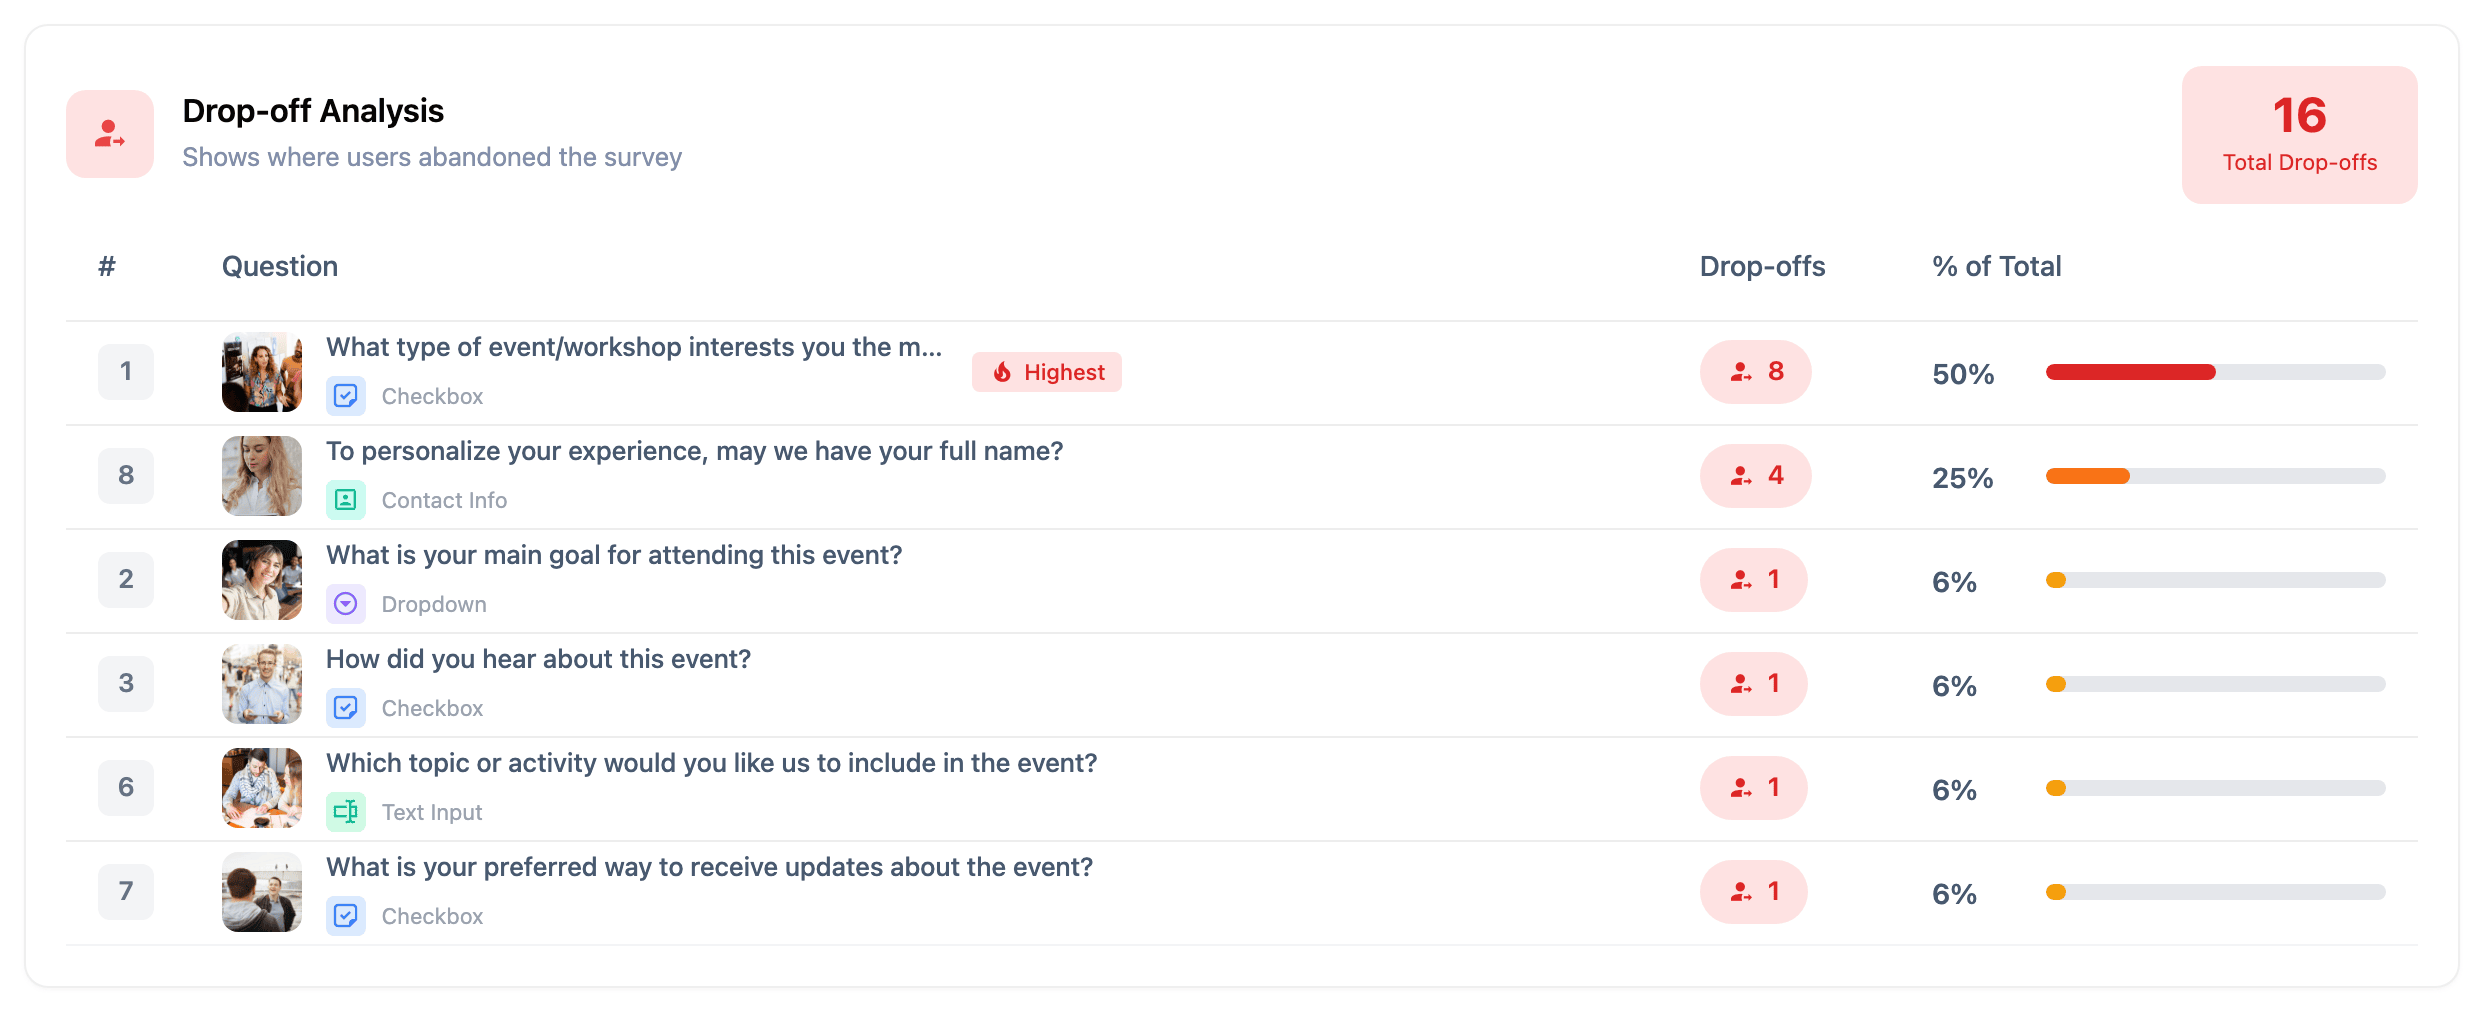
Free shows an upgrade prompt in place of this report; everything above it on the Insights screen is identical between editions.
How fresh the numbers are
A survey's numbers are computed together and cached for 15 minutes. Click Refresh to force an immediate recount. Deleting a response or a survey clears this cache automatically, so a deletion on its own doesn't call for a Refresh click.
Comparing this month to last (Pro)
SurveyX's cross-survey analytics dashboard adds a month-over-month comparison — responses, completions, completion rate, and average time, this calendar month against the previous one, using the same 4-hour cap on average time as above. A month with no qualifying completed session shows — instead of 0, and the change itself is left blank if either month is missing data.
Troubleshooting
Completion rate shows 0%. Nobody has started the survey yet — the rate is 0 whenever there are no starts, whether or not you already have responses.
Average time shows an em dash instead of a number. No completed session had a time spent between 0 seconds and 4 hours. Sessions outside that window are excluded from the average rather than pulling it down.
Engagement rate or bounce rate shows an em dash. The view count has fallen below the start count — this can happen after deleting old sessions or responses, since total views never decreases. SurveyX shows — instead of a rate that would be negative or over 100%.
A multi-select question's percentages add up to more than 100%. Expected: each bar is votes ÷ respondents who saw the question, and a respondent can pick more than one option on that question type.